Eight months ago, ChatGPT held 89% of B2B AI referrals. Today, it holds 63%. Claude went from 1.4% to 18.5%. Gemini quadrupled. Perplexity more than doubled. The Big 1 has become the Big 4.
In our October 2025 AI Search Market Share Report, we measured 2,802,519 AI referral sessions across 41 brand sites between May and August 2025. ChatGPT accounted for 89.1% of all AI referrals. Eight months later, we ran Wave 2.
We pulled GA4 referrer data from a fresh anonymized brand panel, triangulated against SimilarWeb’s traffic data across the top five AI surfaces (25.77B visits, January-April 2026), and SensorTower’s iOS rankings as a leading indicator of consumer adoption.
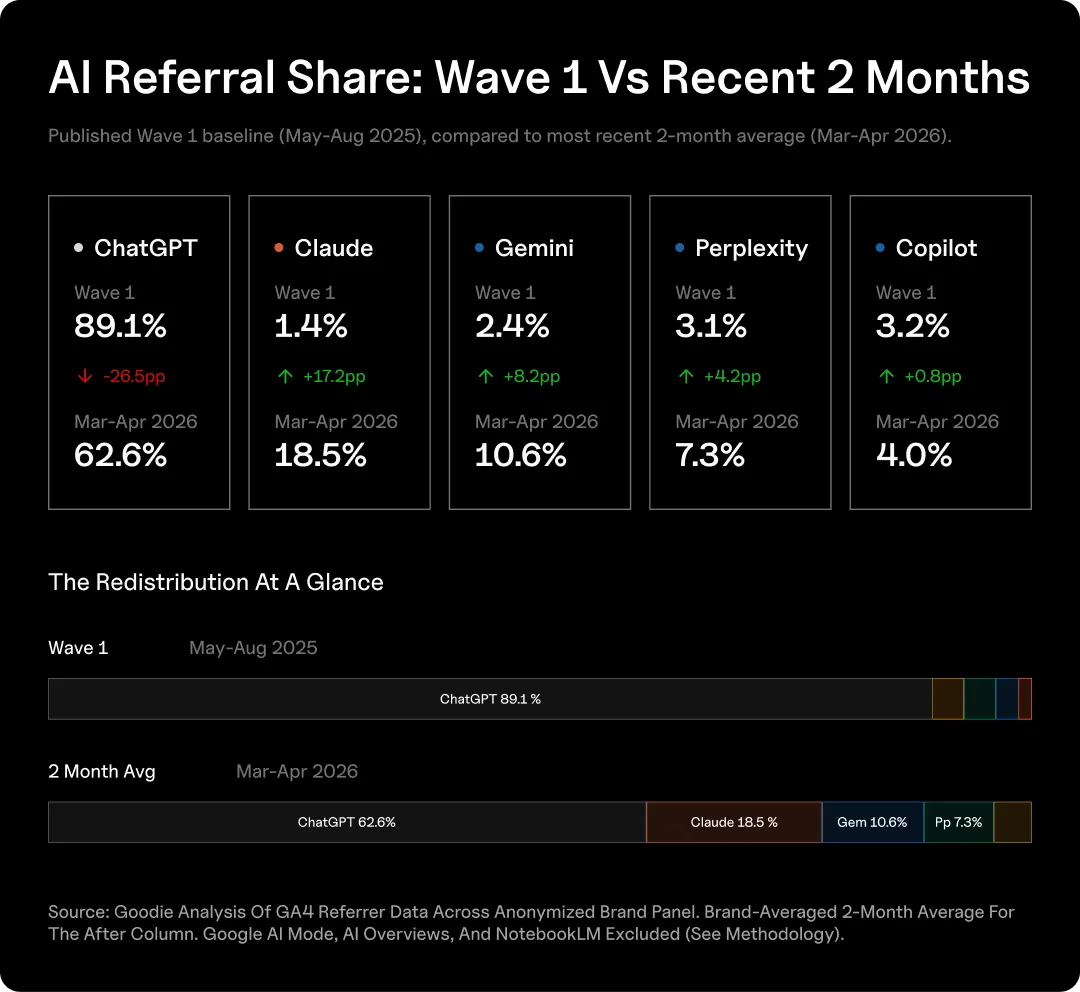
Averaged across the most recent two months (March-April 2026), brand-averaged so each brand counts equally, ChatGPT’s share of measurable B2B AI referrals has fallen to 62.6%. Claude reached 18.5%. Gemini reached 10.6%. Perplexity reached 7.3%. Copilot held flat near 4%.
| Source | Wave 1 (May-Aug 2025) | Recent 2-Month Avg. (Mar-Apr 2026) | Change |
| ChatGPT | 89.1% | 62.6% | -26.55pp |
| Claude | 1.4% | 18.5% | +17.2pp |
| Gemini | 2.4% | 10.6% | +8.2pp |
| Perplexity | 3.1% | 7.3% | +4.2pp |
| Copilot | 3.2% | 4.0% | +0.8pp |
(pp = percentage points. The four headline percentages are cross-source averages of each brand’s share, not slices of one panel-wide denominator. See methodology.)
ChatGPT, Claude, Gemini, and Perplexity now hold nearly 99% of measurable AI referrals. Optimizing only for ChatGPT now covers a third less of the AI traffic landscape than it did a year ago, and the displaced share moved to surfaces with fundamentally different retrieval logic, citation behavior, and user intent.
The Fragmentation Of AI Search
AI Search has restructured twice in 24 months.
Up until 2023, search still meant Google. Roughly 90% global share, ten blue links, one optimization surface. Through 2024 and most of 2025, ChatGPT became the dominant AI search experience. Wave 1 found that ChatGPT held 89% of B2B AI referrals across May to August 2025. Optimizing primarily for ChatGPT was a logical solution.
Eight months later, ChatGPT’s dominance is wavering. Claude, Gemini, and Perplexity have absorbed most of the displaced share. Google’s own AI surfaces (AI Mode and AI Overviews), while still dominant since it rolled out but stay invisible in GA4 because Google doesn’t separately attribute them. Native AI apps strip referrers, pushing more AI-originated sessions into the Direct traffic bucket. The market is now genuinely fragmented across surfaces that differ on every dimension that matters for marketers.
The Surfaces Aren’t Interchangeable
Each major surface uses a different retrieval pipeline, ranking logic, and citation convention. Each serves a different user intent.
- ChatGPT runs its own retrieval stack, layers citations onto generated answers, and indexes the broad web. 900M weekly activities. Usage mixes research, drafting, conversation. Referral behavior is roughly proportional to platform volume.
- Claude ships citations as part of the core answer pattern and skews toward research-stage queries. Roughly 30M consumer MAU but heavy index on knowledge workers and technical buyers. Click-out rate is high relative to platform size.
- Gemini is two surfaces in one: a standalone chat product (750M MAU) and the model powering Google AI Mode and AI Overviews. The chat product behaves like a workplace assistant. The integrated surfaces behave like an enhanced SERP.
- Google AI Mode and AI Overviews sit inside Google Search and resolve queries inside the answer panel. Outbound clicks are suppressed by design. AI Overviews reach roughly 2B monthly users. AI Mode is at 100M+ in the US. These two represent the largest surface but referral data is not separately attributable in GA4.
- Perplexity is citation-first by product design. Research and shopping surfaces produce high outbound click rates. Punches above weight: 7.3% of B2B referrals on 1.9% of AI platform visits.
- Microsoft Copilot lives inside Microsoft 365 with 20M paid enterprise seats. Product center of gravity is task completion in Word, Excel, Outlook, Teams. Not source exploration.
- Grok behaves as a content destination. Users engage with the platform itself (11:54 average visit duration, 16.89 pages per visit). 50–64M MAU. B2B referral output is effectively zero.
- Meta AI, NotebookLM, DeepSeek, Doubao, Yuanbao, Kimi, and Qwen all have distinct audiences and product models. Meta AI’s 1B+ MAU produces near-zero B2B referrals because it lives inside messaging products. NotebookLM is a closed-system research tool.
A single piece of content optimized “for AI” will not perform evenly across these surfaces. The retrieval mechanics are different. The user intents are different. The signals that drive citation differ from those that drive recommendation. ChatGPT and Claude may both cite a brand for a category query but for different reasons and on different evidence. Optimizing for one is not optimizing for the other.
What This Means Strategically
Search has gone from a one-engine market to a one-AI-engine market to a multi-surface fragmented market in roughly 24 months. None of the surfaces is winning decisively, and the share between them moved 26 percentage points in eight months.
The implication is structural, not tactical. A team built around single-channel optimization (Google SEO, or a ChatGPT-first AEO process) is built for a market that no longer exists. The right operating model has three properties:
- Multi-surface by default. The Big 4 are the floor for serious investment. Each gets its own content and measurement workflow.
- Aware of the difficult to measure surface area. AI Mode and AI Overviews matter strategically even though they don’t appear cleanly in GA4. Marketers reporting AI traffic only from referrer logs will systematically undercount and misallocate.
- Built to absorb continued movement. The Big 4 of mid-2026 may not be the Big 4 of mid-2027. Content and measurement infrastructure shouldn’t depend on any single surface staying dominant.
Why We Ran This Now
Three product changes set the stage.
- Anthropic shipped Claude’s web search and inline citation behavior in late 2024 and rolled it out broadly through early 2025. Every Claude session became a potential referrer to the open web. Eight months of accumulated user behavior plus continued product investment shows up in this data.
- Google rolled out AI Mode and expanded AI Overviews coverage through late 2025 and Q1 2026. Both surfaces are now meaningful parts of search for most users, though both are largely invisible in GA4 attribution.
- Perplexity shipped aggressively through 2025 and into 2026: Comet, deeper shopping integrations, citation polish. Its referral share is up roughly 2.4x since Wave 1. The company also climbed iOS Top Grossing during this window.
These supply-side changes explain why the platform mix shifted. The demand-side reason: B2B buyers are using more AI tools, more frequently, for more parts of their workflow.
Our Methodology in Brief
This study triangulates three independent data sources. We deliberately do not break findings down by industry: within-category sample sizes are too small for reliable inference. The focus is model-to-model comparison and trajectory over time.
- GA4 Brand Panel. Confidential anonymized panel of business-facing brands, mostly B2B. Monthly referrer data covering August 2025 through May 2026.
- SimilarWeb. Total platform visits and engagement metrics for ChatGPT.com, Claude.com, Gemini.google.com, Perplexity.ai, and Grok.com over January–April 2026. Total: 25.77B platform visits.
- SensorTower. iOS app store rankings (Free Downloads and Top Grossing) as of early May 2026.
Wave 2 headline figures use the two-month brand-averaged share for March–April 2026. We first compute each brand’s share-of-AI for each source, then average across brands so each brand counts equally regardless of total volume. May 2026 is excluded as a partial month. Wave 1 baseline is Goodie’s October 2025 report covering 41 brand sites and 2.8M AI referral sessions over May–August 2025.
Full statistical methodology and attribution notes are in the appendix.
Finding 1: ChatGPT Lost 26 Points & The Big 4 Now Hold Nearly 99%
The Big 4 (ChatGPT + Claude + Gemini + Perplexity) together hold 99% of the cross-brand average. In Wave 1, the same four held 96%, but ChatGPT alone was 89% of that. The size of the Big 4 is roughly unchanged. The distribution within it has changed dramatically:
- Claude is now #2. In Wave 1, Claude was #5 with 1.35% share. Today, it’s the second-largest AI referral source at 18.5%, ahead of Gemini and Perplexity. The eight-month shift is the largest of any source in the panel.
- Gemini and Claude have effectively traded places with the long tail. In Wave 1, Gemini was #4 and Claude was #5. In Wave 2, they’re #2 and #3, Claude ahead. The product investment from both companies through 2025 shows up here.
- Copilot is essentially flat. From 3.2% to 4.0%. Microsoft 365 Copilot paid seats have quadrupled to roughly 20 million in this same window, but Copilot’s share of B2B referral traffic has not grown proportionally. Consistent with Copilot’s product center of gravity moving toward task completion inside Microsoft 365, not link-out to the open web. Anyone optimizing specifically for Copilot referral traffic should expect modest, slow-growing volume.
- The long tail is noise. Doubao, DeepSeek, Yuanbao, Kimi, Qwen, Grok combined contribute well under 1% of our panel.
Finding 2: Claude Isn’t a Trend, It’s a Trajectory
Direction is unmistakable. Claude’s share is rising at almost every brand we measured, in the same direction, in the same window. ChatGPT’s share is doing the opposite.
We compared each brand’s Claude share of AI traffic in the most recent 30 days against the trailing 90 days, on the 16 brands with enough Claude session volume to support a valid comparison. 14 of 16 brands moved up. 2 moved slightly down. The typical brand grew its Claude share by +7.14pp in the recent window, with a 95% confidence interval of +1.25pp to +25.45pp. The lower bound is positive: even the most conservative estimate of typical growth sits above zero.
Under a one-tailed binomial test, the probability of seeing 14-of-16 brands move in the same direction by chance is 0.21%. Two-tailed sensitivity: 0.42%. Both sit well inside the conventional 5% significance threshold, and an order of magnitude tighter than the typical industry-research bar of “we saw it once and called it a trend.”
Same-window ChatGPT comparison: flat or declining at most brands. The two trajectories aren’t just different. They’re diverging.
This is the data point that matters most for 2026 AEO planning. Claude isn’t growing at one outlier brand or in one outlier month. It’s growing across the panel, across the window, with statistical signal behind it. The April raw share number (27.2% in unsmoothed data) suggests the trajectory may be accelerating, not stabilizing. We’ll know in Q3.
Finding 3: The Year-to-Date Trendline; ChatGPT Down, Claude Up, Others Stable
Plotting brand-averaged share month by month with a 3-month centered rolling average to smooth single-month noise:
| Month | ChatGPT | Claude | Gemini | Perplexity | Copilot |
| Jan 2026 | 72.5% | 11.8% | 7.9% | 8.5% | 4.2% |
| Feb 2026 | 73.5% | 10.8% | 9.4% | 6.9% | 4.3% |
| Mar 2026 | 64.5% | 16.8% | 10.8% | 6.7% | 4.5% |
| Apr 2026 | 62.6% | 18.5% | 10.6% | 7.3% | 4.0% |
| Change Jan → Apr | -9.9pp | +6.7pp | +2.7pp | -1.2pp | -0.2pp |
- ChatGPT is the only line that decisively trends down. From 72.5% in January to 62.6% in April. Flat through January and February, then a sharp drop in March and April. The 10-point decline inside a single quarter is faster than any prior period we’ve observed.
- Claude is the only line that decisively trends up. From 11.8% to 18.5%, most of it concentrated in March and April. In raw (unsmoothed) numbers, Claude’s April 2026 share is 27.2%, the highest single-month value we’ve observed for any non-ChatGPT source in either wave.
- Gemini, Perplexity, and Copilot are roughly stable. Gemini drifted up. Perplexity drifted down. Copilot held at 4%. The dramatic share movement in 2026 is happening between ChatGPT and Claude.
The April inflection on Claude (raw +17pp in a single month) is the data point most likely to repeat or accelerate in Wave 3. Mid-2026 is shaping up as the period when Claude either consolidates its share or continues to take it from ChatGPT. We’ll re-measure in Q3.
Finding 4: AI Traffic Engages 30% Longer Than Google, 20% Longer Than Bing
The four major AI referrers cluster tightly on engagement when pooled across the panel. They also outperform every traditional source on engagement quality.
For engagement metrics, we use the full panel L90 window for sample robustness. This is a different cut of the same dataset than the share-of-AI analysis above.
| Source | L90 Sessions | Avg. Engagement Time | Engagement Rate |
| Gemini | 890 | 62.2s | 72.0% |
| ChatGPT | 4,340 | 61.4s | 69.7% |
| Perplexity | 555 | 55.8s | 64.5% |
| Claude | 802 | 54.6s | 64.8% |
| AI sources average | 6,667 | ~58.5s | ~67.8% |
| Bing Organic | 8,754 | 47.9s | 58.4% |
| Google Organic | 113,624 | 44.2s | 61.8% |
| YouTube | 694 | 31.9s | 56.1% |
| Direct | 307,087 | 18.4s | 37.9% |
| 50,068 | 4.2s | 24.9% | |
| 25,488 | 4.1s | 12.8% |
- AI sources engage roughly 30% longer than Google Organic and roughly 20% longer than Bing Organic. Gemini and ChatGPT lead among AI sources. Claude and Perplexity sit slightly lower in raw seconds, but show a research-stage signature (particularly Claude).
- The engagement-quality story is real. AI traffic spends meaningfully longer per session and engages at a higher rate than the dominant traditional channels. The “AI traffic is higher quality” claim, sometimes used loosely in AEO content, is backed by panel-level data when measured against the right benchmarks. AI traffic is 20–30% better-engaged than Organic Search and dramatically better than Direct, Social, and Forum traffic.
- LinkedIn and Reddit are surprisingly weak engagement channels. Both clock around 4 seconds average engagement time. Consistent with link-preview clicks: users open a tab, see what the post is about, bounce. Marketers benchmarking AI search traffic against Social referrals should know the comparison is favorable on engagement quality.
One source worth flagging: Bing Organic is consistently strong. 47.9 seconds engagement, 58.4% rate. Better than Google Organic on engagement time. Bing’s professional-buyer skew deserves more attention than it gets in AEO content.
Finding 5: SimilarWeb Supply Side, Platform Visits Don’t Match Referral Output
Layering SimilarWeb’s platform-level visit data on top of our GA4 referral data reveals a structural mismatch between platform popularity and B2B referral output. The referral share column below normalizes each source’s share of the Big 4 + Copilot universe to 100%, so it’s directly comparable to the visit-share column.
| Platform | Total Visits Jan-Apr 2026 | Visit Share | Recent Referral Share (Normalized) |
| ChatGPT | 16.59B | 64.4% | 60.8% |
| Gemini | 7.47B | 29.0% | 10.3% |
| Grok | 904M | 3.5% | ~0% |
| Perplexity | 476M | 1.85% | 7.1% |
| Claude | 333M | 1.29% | 18.0% |
| Copilot | Not measured | n/a | 3.9% |
| Total | 25.77B | 100% | 100% |
- ChatGPT is roughly proportional. Referral share is within four points of visit share. ChatGPT users behave as a representative slice of AI users on the click-out dimension.
- Gemini’s referral share is well below its visit share. 29% of platform visits, ~10% of B2B referrals. Partially explained by Gemini’s role inside Google Workspace (task completion and document generation, not source exploration), and partially because Gemini’s long-form reasoning increasingly answers questions inside the chat interface rather than sending users out. Marketers benchmarking AEO investment by Gemini’s raw visit volume will overestimate its referral importance.
- Claude and Perplexity send more referrals than their visit share suggests. Claude has 1.3% of AI platform visits but 18% of B2B referrals. Perplexity has 1.9% of visits but 7% of referrals. The pattern reflects platform usage profile: both Claude and Perplexity skew toward research and source-finding, whereas Gemini skews toward in-product workflow tasks.
- Our brand panel may also overindex on audiences that use Claude and Perplexity, so we’re cautious about over-claiming here.
- Grok generates essentially no measurable B2B referrals. 904M visits over four months, effectively zero attributable referrals. The audience engages with the platform itself, not the open web.
The takeaway: AI platform popularity is not the same as B2B referral output. The ratio between the two varies by 10x or more across the four major platforms. A complete view of where to invest AEO effort needs to look at both volume and outbound behavior.
On-platform engagement (SimilarWeb)
| Platform | Avg. Visit Duration | Pages Per Visit | Bounce Rate | Visits Per Unique Visitor |
| Grok | 11:54 | 16.89 | 29.24% | 7.20 |
| Gemini | 7:16 | 4.07 | 29.47% | 8.80 |
| ChatGPT | 5:56 | 3.61 | 32.83% | 11.59 |
| Perplexity | 4:45 | 3.70 | 31.80% | 6.45 |
| Claude | 3:12 | 2.61 | 57.94% | 2.52 |
- ChatGPT has the highest visits-per-unique-visitor at 11.59x. Users come back almost daily.
- Grok has the highest in-session depth (16.89 pages, 11:54 duration), consistent with conversational continuous use and zero outbound.
- Claude has the shortest in-session duration and the highest bounce rate among the major engines, but the visits it does send out convert to engaged sessions on brand sites.
Different engines, different usage patterns, different referral signatures. The “AI platform” category is structurally heterogeneous in 2026.
The User-Base View: Active User Counts by Platform
SimilarWeb measures visits. SensorTower measures app store ranking momentum. Neither captures how many actual humans are using each platform regularly.
Each major AI company reports active user numbers on different cadences with different definitions. Pooling the most recent figures gives the clearest picture available.
| Platform | Active Users (Most Recent Reported) | Period | Source |
| ChatGPT | 900M WAU | Feb 2026 | OpenAI |
| Meta AI | 1.2B+ MAU | Q4 2025 | Meta |
| Google AI Overviews | ~2B MAU | Q1 2026 | Alphabet |
| Gemini (app) | 750M MAU | Q4 2025 | Alphabet |
| Google AI Mode | 100M+ MAU | Q1 2026 | Alphabet |
| Grok (xAI) | 64M MAU | Early 2026 | Third-party |
| Microsoft Copilot | 420M total / 20M paid M365 seats | Apr 2026 | Microsoft |
| Perplexity | 45M MAU | Early 2026 | Third-party |
| Claude (consumer) | ~30M MAU (web + mobile) | Early 2026 | Third-party |
- ChatGPT. OpenAI announced in late February 2026 that ChatGPT reached 900M weekly active users, within striking distance of 1 billion. Annualized revenue crossed $20B in 2025 and topped $25B by February 2026. Workplace seats exceeded 7 million. Paid subscribers reached 50M, with January and February 2026 reportedly the largest months for new subscribers in OpenAI’s history.
- Google’s stack. Several distinct user pools. Gemini app surpassed 750M MAU in Q4 2025. AI Overviews now serves approximately 2B people each month. 120,000+ enterprises use Gemini. Google AI Mode has surpassed 100M MAU in the US alone. Combined, Google’s three AI surfaces reach a larger user base than any single competitor.
- Claude. Anthropic doesn’t publicly disclose consolidated MAU. Third-party estimates put consumer-side Claude at roughly 30M MAU in early 2026 (18.9M web, 12.48M mobile). Claude’s mobile app hit 12.48M MAU in February 2026, a 49% month-over-month increase. Anthropic crossed $14B in annualized revenue in February 2026, serving 70% of the Fortune 100 with more than 300,000 business customers. Closed a $30B Series G at a $380B post-money valuation. Enterprise penetration is the bigger story than consumer MAU.
- Perplexity. Approximately 45M MAU by late 2025/early 2026, more than doubling from 22M at the start of 2025. The wide range reflects measurement methodology differences. Monthly web visits ~240M, with 780M monthly queries when last reported. Annualized revenue near $500M.
- Microsoft Copilot. 20M paid enterprise seats as of April 2026, with companies paying for over 50,000 seats quadrupling. Total active users across all Copilot surfaces 420M. Paid AI subscriber market share dropped from 18.8% to 11.5% between July 2025 and January 2026. The drop in voluntary paid share alongside enterprise seat growth illustrates the “provisioned vs. preferred” gap.
- Meta AI. Over 1.2B MAU with approximately 3.65B DAU across WhatsApp, Instagram, Facebook, and Messenger. The consumer reach is enormous, but Meta AI is integrated into messaging and social workflows where outbound link behavior is rare by design. This is the data point that most starkly illustrates the gap between platform popularity and B2B referral output: 1B+ MAU produces effectively zero measurable B2B referrals in our panel.
- Grok (xAI). Approximately 64M MAU by early 2026 according to multiple third-party sources, more than doubling from mid-2025. US chatbot market share rose from 1.9% in January 2025 to 17.8% in January 2026. Despite this growth, Grok’s outbound referral volume in our B2B panel was effectively zero.
Two structural realities this view makes unmissable:
- Total AI user reach is multi-billions. The referral landscape concentrates in a much smaller set. ChatGPT (900M WAU) plus Gemini (750M MAU) plus Meta AI (1.2B MAU) plus AI Overviews (2B) sums to a surface area larger than any individual social platform. Yet B2B referrals concentrate in just four engines. The mismatch between user reach and referral output is the central feature of the current AI search landscape.
- Claude’s structural position is now visible. Roughly 30M consumer MAU, small relative to ChatGPT and Gemini. But enterprise penetration (70% of Fortune 100, 300K+ business customers) and per-visit referral characteristics give Claude disproportionate B2B importance. The 18.5% of B2B AI referrals Claude produces is consistent with a platform whose user base, while smaller in count, indexes heavily toward research-stage knowledge workers and technical buyers.
Finding 6: AI vs. Every Other Source Engagement
Widening the lens beyond AI-vs-AI to include the major non-AI sources gives the strongest argument yet for why AI search traffic deserves disproportionate marketing attention.
| Source | Average Engagement Time | Engagement Rate |
| Direct | 18.4s | 37.9% |
| Google Organic | 44.2s | 61.8% |
| 4.2s | 24.9% | |
| 4.1s | 12.8% | |
| Bing Organic | 47.9s | 58.4% |
| AI Sources (combined) | ~58s | ~68% |
| YouTube | 31.9s | 56.1% |
Both readings of this table matter:
- On absolute volume, AI is still small. 6,667 sessions versus 113,624 from Google Organic versus 307,087 from Direct. Even with a 10x growth rate, AI is a single-digit percentage of total inbound at most brands. Anyone treating AI as the dominant traffic channel today is wrong about timing.
- On engagement quality, AI is the best-performing source. 58 seconds average engagement time and 68% engagement rate beats every other channel. AI traffic engages 31% longer than Google Organic, 21% longer than Bing Organic, and roughly 14x longer than LinkedIn or Reddit.
AI is the highest-quality referral channel by per-session metrics and the smallest by volume, simultaneously. Both facts are true. The right reaction isn’t dismissing AI as too small to matter, or over-rotating on it as the only thing that matters. The right reaction is recognizing AI as the highest-quality referral channel, growing fast, and worth investment proportional to that trajectory.
Finding 7: The Dark Traffic Problem
Every number in this report understates AI’s true footprint. Two structural reasons.
Direct Traffic Absorption
Across our panel, direct traffic averages roughly 31% of total sessions. Some is real: branded type-ins, returning customers, CRM-internal navigation. Not 31%.
A meaningful share of “direct” traffic in 2026 is AI-driven traffic that lost its referrer. This happens when:
- Users copy a link from ChatGPT, Claude, or Perplexity and paste it into a new tab (referrer stripped)
- Native AI desktop and mobile apps strip referrers
- Privacy-first browsers and ad blockers strip referrers on outbound clicks
- Users navigate through a Claude or ChatGPT app to a browser
Even a conservative estimate (5% of direct is misattributed AI) would substantially increase reported AI share. At a 31% direct share, 5% of direct equals more than 2x our currently-attributed AI total. The real AI footprint is materially larger than referrer logs show.
Google’s Bundled AI Surfaces
Google doesn’t separately attribute AI Mode or AI Overviews referrals. Both are bundled into google / organic along with traditional search clicks. There’s no clean, established way to isolate them in GA4. Given AI Mode and AIO are now meaningful parts of Google’s search experience for most users, a non-trivial slice of what currently gets reported as Google Organic traffic is actually AI-driven.
We can’t precisely size this from the data here. Solving it is the subject of a separate methodology paper Goodie expects to publish in Q3–Q4 2026.
Anyone reporting AI traffic share to leadership using only GA4 referrer data is undercounting it in two structural ways. The real picture is materially larger than the visible one.
The Consumer Adoption Signal: Claude Is #2 on iOS
SimilarWeb measures platform visits. SensorTower measures something different: app store ranking momentum, a leading indicator of recent installs and active monetization.
As of early May 2026 on iOS.
Free Downloads (Top 6):
- ChatGPT
- Claude by Anthropic
- Google Gemini
- Meta AI
- Microsoft Authenticator (non-AI)
- Grok
Top Grossing (Top 6):
- ChatGPT
- Claude by Anthropic
- Grok
- Dropbox (non-AI)
- Perplexity
- CamScanner (non-AI)
Claude is #2 in both categories on iOS. ChatGPT has 6.99M ratings on its app; Claude has 126K. Lifetime install base is incomparable. But for the recency signal app store rankings measure, Claude has caught up to and surpassed Gemini for new installs and revenue capture. This corroborates the GA4 referral trajectory from a completely independent data source.
Grok at #3 in Top Grossing despite zero measurable B2B referral output confirms its positioning as a content destination, not a search interface. The disconnect between Grok’s app-revenue success and its B2B-referral irrelevance is the cleanest example in the data of why AI platform popularity and AI search referral value are two different things.
Perplexity #5 in Top Grossing despite a small install base. Punching above weight, consistent with the over-indexing in referral share vs visit share.
The Wave 2 GA4 trajectory and the SensorTower ranking trajectory tell the same story from different angles.
What This Means for B2B Marketers
Four operational implications.
- A single-engine optimization strategy is fragile. The market moved from Google-dominant to ChatGPT-dominant to fragmented in 24 months. ChatGPT held 89% of AI referrals in August 2025 and 63% eight months later. Claude went from 1.4% to 18.5% in the same window. The volatility is the point. Any AEO strategy that relies on one or two surfaces staying dominant is planning for a market that no longer exists.
- Different AI sources play different funnel roles. ChatGPT and Gemini behave roughly like Google Organic on engagement metrics. Claude indexes deeper on research-stage queries with longer engagement times and a behavioral signature that suggests later-funnel conversion via direct or branded search. Perplexity sends source-verified researchers. Each source needs a content posture matched to its funnel position. A single AEO brief for “AI search” is increasingly wrong.
- AI is the highest-quality referral channel by per-session metrics, even though minor by absolute volume. Investment should scale with trajectory and quality, not current absolute volume.
- Measurement infrastructure has to catch up. GA4 referrer data is conservative by design and the gap is growing as AI usage moves to native apps and as Google bundles AI Mode and AIO into google / organic. Marketers reporting on AI traffic should explicitly disclose three numbers (reporting only on the first is no longer accurate):
- AI share from referrer attribution (what GA4 shows)
- Estimated direct traffic likely to be AI (a methodology assumption)
- AI Mode / AI Overviews exposure (which won’t appear in referrer data at all)
What’s Next
There are three follow-ups in the publication pipeline.
- The B2B AI Search Funnel & Pipeline Update (Q3 2026). A successor to our original 117K-lead B2B funnel study, updated with Claude as a tracked source, an expanded brand panel including CRM and pipeline data, and multi-touch attribution where data permits. This is where we resolve whether Claude users convert later via direct or branded search.
- The Dark AI Traffic Methodology Paper (Q3–Q4 2026). Quantifying the share of “direct” traffic that is actually AI-driven, plus a method for estimating Google AI Mode and AI Overviews exposure from indirect signals (page-level metrics, AI crawler logs, behavioral signatures).
- The AI Search Benchmark Report (Q4 2026). A 50–100 brand benchmark study formalizing the AI Visibility Index (AVI) as an industry standard for measuring brand presence in AI search results.
Want to join Wave 3? Get in touch.
Appendix: Methodology, Scope & Limitations
Scope. Wave 2 of a longitudinal AI search referral study. Wave 1 was Goodie’s October 2025 report covering 41 brand sites and 2,802,519 AI referral sessions over May–August 2025. Wave 2 covers August 2025 through May 2026.
Primary measurement approach. Wave 2 current-state figures are brand-averaged two-month averages for March–April 2026. We first compute each brand’s share-of-AI for each source, then average across brands so each brand counts equally regardless of total session volume. We chose this over pooled (volume-weighted) reporting because the panel includes brands with very different traffic scales, and pooled reporting would be dominated by the single largest brand.
One property worth flagging: the cross-source averages for each AI engine are computed independently, so the five reported headline figures (62.6% ChatGPT, 18.5% Claude, 10.6% Gemini, 7.3% Perplexity, 4.0% Copilot) don’t sum to exactly 100%. They sum to 103.0%, reflecting that each brand’s individual shares sum to 100% but the cross-brand mean doesn’t preserve that constraint. The “Big 4 holds nearly 99%” claim uses the cross-source sum (62.6 + 18.5 + 10.6 + 7.3 = 99.0%). The SimilarWeb comparison in Finding 5 normalizes the referral-share column to sum to 100% across the Big 4 + Copilot universe so the visit-share and referral-share columns are directly comparable.
The trendline uses a 3-month centered rolling average to smooth single-month noise. May 2026 is excluded as a partial month (data window ends May 5).
Statistical methodology. The Claude trajectory significance test (Finding 2) is a one-tailed binomial test on the per-brand sign of recent-vs-trailing share shift, applied to the 16 brands with sufficient Claude session volume for a valid comparison. Result: 14 positive shifts, 2 negative, p = 0.0021 (one-tailed). The one-tailed alternative was pre-specified given the directional prior from Wave 1 and Anthropic’s late-2024 product launch of Claude web search. Two-tailed sensitivity: p = 0.0042, well inside the 0.05 threshold. The bootstrap median shift and 95% CI use 5,000 brand-level resamples.
Engagement methodology. Engagement time and engagement rate analyses use the full panel L90 window (Feb 5 – May 5, 2026) rather than the two-month average. The longer window is necessary for sample robustness on these metrics, where small samples produce noisy results.
AI source classification. Sources were classified into AI categories based on session source/medium pattern matching against the dedicated domains for ChatGPT (chatgpt.com), Claude (claude.ai), Perplexity (perplexity.ai), Gemini (gemini.google.com), Copilot (copilot.com / copilot.microsoft), Meta AI (meta.ai), Grok, DeepSeek, Doubao, Yuanbao, Kimi (Moonshot), and Qwen.
Two important attribution exclusions.
- Google AI Mode and AI Overviews are excluded because Google does not separately attribute them in GA4. Both surfaces produce google / organic referrals indistinguishable from traditional search clicks. We do not include any speculative estimate for these surfaces in this report.
- NotebookLM is excluded because its product architecture as a closed-system research tool means its outbound referral behavior is structurally different from the open-web AI search interfaces.
Time alignment. SimilarWeb data covers Jan–Apr 2026. GA4 panel covers Aug 2025–May 2026 (with the two-month headline using Mar–Apr 2026 only). SensorTower data is a snapshot from early May 2026.
What we don’t claim. Updated absolute market share. The 41-brand Wave 1 baseline remains the more comprehensive reference for absolute share. We don’t make pipeline or revenue claims (those come in the funnel pipeline study scheduled for Q3 2026). We don’t project forward shares. We don’t synthetically generate or model brand observations: every brand-level data point in this study is a real first-party GA4 measurement of a real brand we have direct access to.
What we do claim. The directional shifts observed between Wave 1 and Wave 2 are real, statistically supportable, and directionally robust. The AI referral landscape has shifted from one-engine dominance to four-engine plurality. Claude’s growth is observable across multiple independent brands at conventional one-tailed statistical significance. AI traffic engages meaningfully better than every other major referral channel by per-session metrics.