Key Takeaways
- Deterministic AEO metrics (revenue attribution, conversion funnel tracing, closed-loop pipeline data) are tied to a verified identifier and can be reported as hard facts.
- Probabilistic AEO metrics (visibility score, sentiment, mention frequency, share of voice) are statistical estimates built from sampling AI models, and should be reported as trends, not single-day snapshots.
- Report probabilistic metrics over a 30- to 60-day window. A one-day swing is normal statistical variance, not a signal that something broke.
- A visibility score moving without any strategy change is expected behavior in models built on retrieval-augmented generation (RAG), not a sign that tracking is broken.
- Goodie’s Analytics & Attribution tool closes the loop, tracing probabilistic visibility signals through to the deterministic revenue outcomes leadership actually trusts.
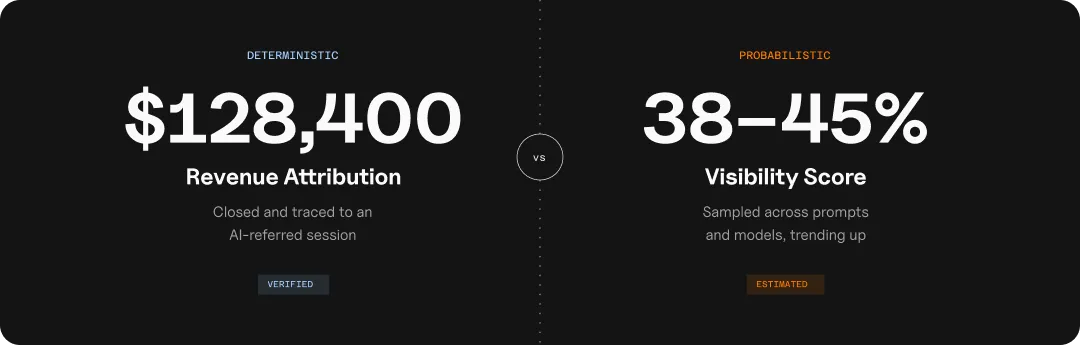
A marketing manager reports last month’s AI visibility score to the CMO. The number is up. Then comes the question: “Are you sure that’s accurate?” There’s no confident answer, because the number was never built to carry that kind of certainty in the first place.
That’s the moment AEO reporting goes wrong. This isn’t a hypothetical: 76% of marketers running AI-search tactics right now have little to no proven attribution behind them, which means most reporting decks are already resting on more confidence than the data supports. Some metrics are hard facts, tied to a verified conversion or a closed deal. Others are statistical estimates of how AI models are currently representing a brand. Report both the same way, and a single bad week gets treated like a broken program, or a real, verified result gets buried under hedging it never needed. Neither mistake is about the data being wrong. It’s about the number being in the wrong room.
| Metric | Type | What It Measures | Example |
| Revenue Attribution | Deterministic | Closed revenue traced to a specific AI-sourced session | A $40k annual contract traced back to a session that started with a ChatGPT recommendation |
| Conversion Funnel Tracing | Deterministic | The step-by-step path from AI-referred visit to conversion event | A Perplexity-referred visitor viewing the pricing page, then booking a demo three days later |
| Closed-Loop Pipeline Data | Deterministic | A specific session matched to a specific closed deal in the CRM | An AI-sourced lead in HubSpot marked “Closed Won,” with the originating session logged |
| Visibility Score | Probabilistic | How often the brand surfaces across a tracked set of prompts and models | The brand appears in 42% of sampled “best AEO platform” prompts across ChatGPT, Perplexity, and Gemini |
| Sentiment Analysis | Probabilistic | How positively or neutrally AI models frame the brand when it surfaces | Model responses describing the brand as a “strong option for enterprise teams” vs. neutral factual mentions |
| Mention Frequency | Probabilistic | How often the brand is named across sampled prompts | The brand is named in 18 of 50 tracked category prompts this month |
| Share of Voice | Probabilistic | The brand’s share of mentions relative to competitors on the same topics | 28% share of voice against four named competitors in the “AI analytics tools” topic cluster |
Why AEO Metrics Aren’t All the Same Kind of Number
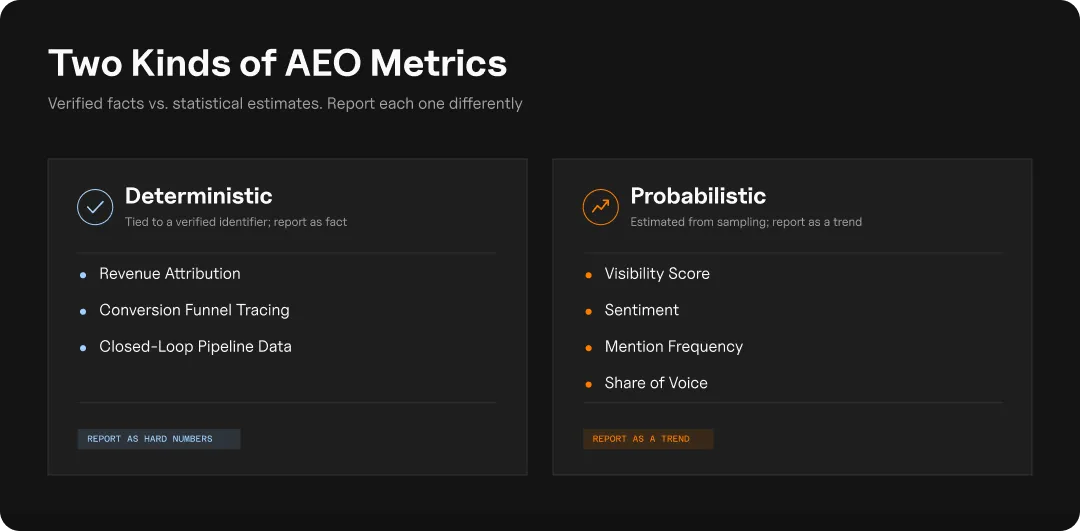
Deterministic metrics are verified. They’re tied to a real identifier: a session that closed, a conversion that logged, a deal that’s in the CRM. Report them with full confidence, because they happened and they’re traceable.
Probabilistic metrics are statistical estimates. They’re built by sampling how AI models respond to a set of prompts, then aggregating what comes back. Report them as directional signals, because they describe a pattern, not a single verified event.
This split exists because of how AI models actually generate answers. Two things drive it:
- Retrieval varies. AI models use retrieval-augmented generation (RAG), pulling live context to answer each prompt. The same prompt asked twice can pull a different set of sources, which means different citations, different framing, sometimes a different answer entirely.
- Generation varies, even on identical context. LLM inference itself is nondeterministic at the token level, even with sampling turned off. So the same retrieved sources still don’t guarantee the same output twice.
Traditional deterministic channels don’t have this problem. A rank tracker checks a keyword’s position and gets a number that holds until the algorithm updates or a competitor outranks the page, stable enough to report as fact. An AI visibility check can return a different citation set an hour later, for reasons that have nothing to do with anything the brand did.
That’s what makes visibility, sentiment, and share of voice inherently probabilistic in a way rankings and CRM records never were. Reporting an AEO number with the same certainty as a keyword rank is where the trust problem starts with stakeholders. AEO metrics need to be reported the way a statistical estimate deserves: as a trend with a confidence level, not a fixed fact.
Which Goodie Metrics Are Deterministic
These are the metrics tied to a verified identifier: a specific session, traced to a specific outcome, that either happened or didn’t.
- Revenue attribution: Closed revenue traced back to an AI-sourced session
- Conversion funnel tracing: The path from AI-referred visit to conversion event, step-by-step
- Closed-loop pipeline data: A specific session matched to a specific closed deal in the CRM
Because these numbers are anchored to a real transaction, they can be stated plainly and without hedging. If closed-loop pipeline data shows a specific enterprise deal traced back to a specific AI-referred session, that’s not an estimate of what probably happened. It’s a record of what did happen, verifiable the same way any other CRM-sourced revenue figure is verifiable. Treat it accordingly in a board deck: as a number that stands on its own, with no caveat about model variability attached to it.
Which Goodie Metrics Are Probabilistic
These are statistical reads on a system that produces a different answer every time you ask it.
- Visibility score: How often the brand surfaces across a tracked set of prompts and models
- Sentiment analysis: How positively or neutrally AI models frame the brand when it does surface
- Mention frequency: How often the brand is named across sampled prompts
- Share of voice: The brand’s share of mentions relative to competitors on the same topics
Treating these metrics for what they are is an honest reflection of how the underlying models work, not a hedge. A visibility score isn’t a soft version of a real number. It’s the correct way to measure something that is, by nature, a distribution rather than a fixed point, the same way tracking AI citations and share of voice always involves sampling rather than a single lookup. Sampling a hundred prompts across four models and aggregating the results is a legitimate measurement method. It’s the same logic that underlies polling, brand-tracking studies, and market research: no single data point is the answer, but the pattern across a large enough sample is meaningful and worth acting on.
How to Report Each Type Without Losing Credibility
Present Deterministic Metrics as Hard Numbers
State these with full confidence. A dollar figure tied to closed-loop pipeline data doesn’t need a qualifier, a range, or a “roughly.” It’s tied to a verified conversion, and it should be reported the way any other revenue number would be: as fact.
Present Probabilistic Metrics as Trends, Not Snapshots
This is the practical takeaway of the entire piece, and it deserves real weight.
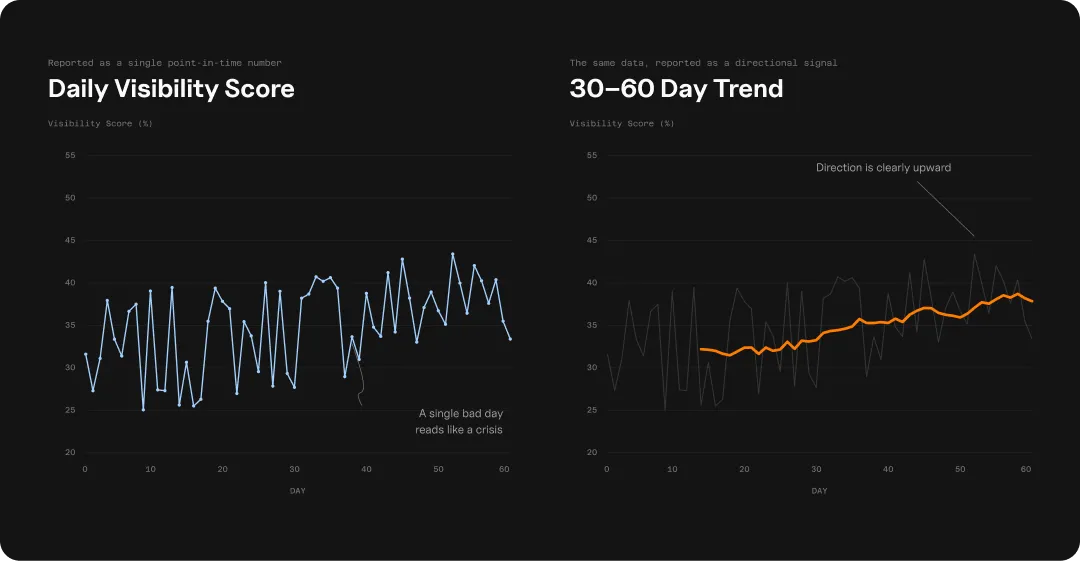
Report probabilistic metrics as a trend across a 30- to 60-day window, never as a single point-in-time number. A single day’s visibility score reflects one sample of a variable system. It moves up and down for reasons that have nothing to do with the work a team shipped that week. A 30- to 60-day trend line smooths that noise out and shows the actual direction the brand is moving in.
This is also the fix for the most common credibility mistake in AEO reporting: reacting to one day’s score movement as if it were a hard signal. It isn’t. It’s normal statistical variance in how models retrieve and surface content, and treating it as anything more sets a team up to explain a swing that was never meaningful in the first place.
In practice, this means the monthly leadership update should show a line, not a single dot. Instead of “visibility score is 42% this month,” report “visibility score has held between 38% and 45% over the past 60 days, trending upward.” The second version survives scrutiny. It shows the range, names the direction, and doesn’t collapse the moment someone asks about a specific day’s dip.
Why Your Visibility Score Moved Without Changing Anything
Session-to-session and prompt-to-prompt variability is expected. It should never be carried as a red flag or a sign that tracking is broken.
Because AI models pull live context on each query, the same prompt can surface a different set of citations from one session to the next, even with zero changes to the underlying content or strategy. A visibility score built from that kind of system will naturally drift within a range. The right response to a single day’s dip is to check whether the trend line has actually moved, not to treat it like an emergency.
This question comes up constantly, and it’s a fair one to ask. A team that shipped nothing new, changed no pages, and ran no campaigns can still watch a visibility score swing several points in a week. This is the same underlying behavior that makes AEO measurement probabilistic in the first place. The response isn’t to defend the number, apologize for it, or dig for a root cause that doesn’t exist. It’s to point back to the 30- to 60-day trend and confirm whether the direction is still intact.
Connecting the Two: Making Probabilistic Signals Credible to Stakeholders
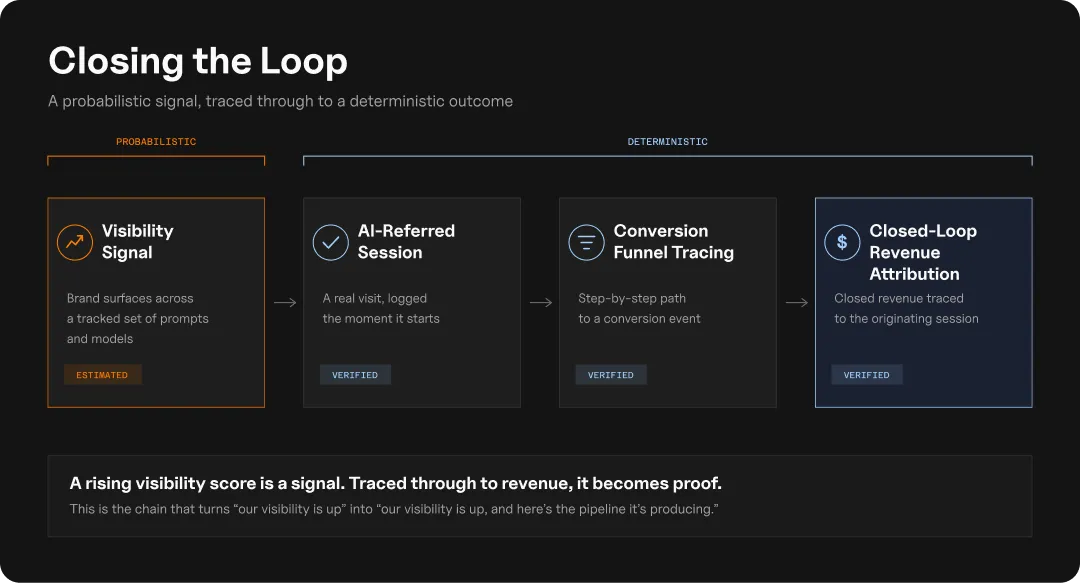
A rising visibility score is interesting to a marketing team and unconvincing to a CMO on its own. Probabilistic signals earn leadership’s trust once they’re tied to deterministic outcomes, and that’s exactly what Goodie’s Analytics & Attribution tool is built to do.
Goodie’s closed-loop attribution system connects the two layers directly. Rising visibility and share of voice on a topic can be traced through to the sessions they generate, and those sessions can be traced through the conversion funnel to revenue attribution and closed-loop pipeline data. That chain is what turns “our visibility score is up” into “our visibility score is up, and here’s the pipeline it’s producing.” One of those statements gets funded. The other gets questioned.
This is also what protects the team the next time a probabilistic metric dips. A visibility score decline reported alongside a stable or growing AI-sourced pipeline reads very differently than the same decline reported alone. The attribution layer gives leadership the deterministic context to interpret the probabilistic movement correctly, instead of reacting to a number that, on its own, doesn’t say much about whether the program is working.
Report Each Metric With the Confidence It’s Earned
Deterministic and probabilistic metrics aren’t competing ways to measure AEO success. They’re two different jobs in the same story: one proves what already happened, the other shows what’s shifting before it shows up in the business numbers. Reporting each with the confidence level it’s actually earned, hard numbers as hard numbers and trends as trends, is what keeps a team credible the next time a score moves and someone asks whether the number can be trusted.
Ready to connect probabilistic visibility signals to revenue that leadership will trust? See how Goodie’s Analytics & Attribution tool closes the loop, or explore more AI search KPIs worth tracking.
Probabilistic vs. Deterministic AEO Metrics: FAQs
Deterministic metrics are tied to a verified identifier, such as a session traced to a closed deal, so they can be reported as hard facts. Probabilistic metrics are statistical estimates built from sampling AI model responses, like visibility score or sentiment, so they should be reported as trends rather than fixed numbers.
Present revenue attribution, conversion funnel tracing, and closed-loop pipeline data as hard numbers, since each is tied to a verified conversion. Present visibility score, sentiment, mention frequency, and share of voice as trends over a 30- to 60-day window, since each is a statistical read that varies session to session.
Because AI models use retrieval-augmented generation, the same prompt can return different results across sessions even with no changes to a brand’s content or strategy. That session-to-session variability is expected behavior, not a signal that something broke.
Use a closed-loop attribution system that traces AI-referred sessions through the conversion funnel to revenue. Goodie’s Analytics & Attribution tool does this by linking visibility and share of voice data directly to the deterministic outcomes they produce.